
Page 32 - Policy Commission - SecuringTechnology - Critical Metals for Britain
P. 32
32 INTRODUCTION
The rare-earth crisis
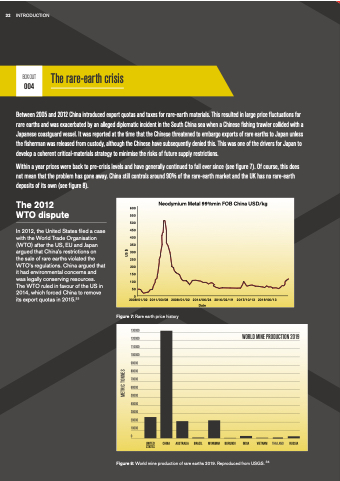
Between 2005 and and 2012 China introduced export quotas and and taxes for for rare-earth materials This resulted in in in large price fluctuations for for rare earths and was exacerbated by an an alleged diplomatic incident in in in in in the South China sea when a a a a a a a a a a a a a a Chinese fishing trawler collided with a a a a a a a a a a a a a a Japanese coastguard vessel It was reported at at at the the time that the the Chinese threatened to to embargo exports of rare earths to to Japan Japan unless the the the fisherman was was released from custody although the the the Chinese have subsequently denied this This was was one of the the the drivers for Japan to to develop a a a a a coherent critical-materials strategy to minimise the risks of future supply restrictions Within a a a a a a a year prices were back to to pre-crisis levels and have generally continued to to fall ever since (see figure 7) Of course this does not mean that the the the problem has has gone away China still controls around 90% of the the the rare-earth rare-earth market and the the the UK has has no no rare-earth rare-earth deposits of its its own (see figure 8) BOX OUT
004
600 550 500 450 400 350 300 250 200 150 100
50 Neodymium Metal 99%min FOB China USD/kg
0 0 2008/01/02 2008/01/02 2011/03/08 2008/01/02 2008/01/02 2014/06/24 2016/02/19 2017/10/13 2019/06/13
Date
The 2012 WTO dispute
In 2012 the United States filed a a a case with the World Trade Organisation (WTO) after the US EU and Japan argued that China’s restrictions on on the the sale of rare earths violated the the WTO’s regulations China argued that it had environmental concerns and was legally conserving resources The WTO ruled in in favour of the US in in 2014 which forced China to remove its export quotas in 2015 33
Figure 7: Rare earth price history
130000 120000 110000 100000 90000 80000 70000 60000 50000 40000 30000 20000 10000 0 WORLD MINE PRODUCTION 2019 UNITED STATES
CHINA
AUSTRALIA
BRAZIL
MYANMAR
BURUNDI
INDIA
VIETNAM
THAILAND
RUSSIA
Figure 8: World mine production of rare earths 2019 Reproduced from USGS 34
METRIC TONNES
US$
