
Page 84 - Policy Commission - SecuringTechnology - Critical Metals for Britain
P. 84
84 PRIMARY MATERIALS
JEWELLERY AND INVESTMENT
A significant amount of platinum is locked up as metal in in jewellery or in in metal bars held by banks and physical exchange-traded funds (ETFs) (see figure 77) The amount held or sold depends on market sentiment During 2019 for example investors added over one million ounces of platinum to to their ETF holdings taking the the total volume
of platinum under investment to a a record 3 4 million troy ounces (>100 tonnes) This quantity is is equivalent to to 57% of the 2019 primary Pt supply In contrast physical investment in in in palladium ETFs reached a a a a a peak in in in 2015 but holdings have have declined sharply since then as record prices have have prompted profit-taking and the amount dropped to around 590 000 ounces at the by August 2019 PGM Metal Prices
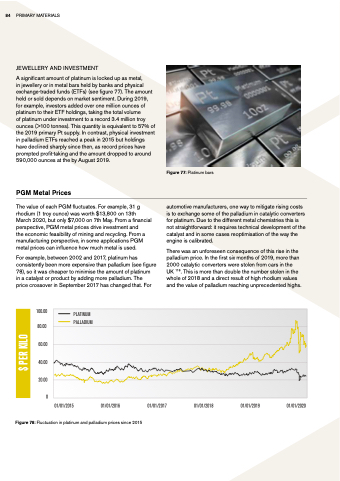
The value of each PGM fluctuates For example 31 g rhodium (1 troy ounce) was worth $13 800 on 13th March 2020 but only $7 000 on on 7th May From a a a a a financial perspective PGM metal prices drive investment and the economic feasibility of mining and recycling From a a a manufacturing perspective in in some applications PGM metal metal prices can influence how much metal metal is used Figure 77: Platinum bars automotive manufacturers one way to to mitigate rising costs is to exchange some of the palladium in catalytic converters for platinum Due to the different metal chemistries this is is is not straightforward: it requires technical development of the catalyst and in some cases reoptimisation of the the way the the engine is calibrated There was an unforeseen consequence of this rise in the palladium price In the first six months of 2019 more than
2000 catalytic converters were stolen from cars in the For example between 2002 and 2017 platinum has consistently been more expensive than
palladium (see figure 78) so it was cheaper to minimise the amount of platinum UK
in in a a a a a a catalyst or or product by adding more palladium The price crossover in September 2017 has changed that For 100 00 00 80 00 60 00 40 00 20 00 0 PLATINUM PALLADIUM
01/01/2015
01/01/2016
01/01/2017
01/01/2018
01/01/2019
01/01/2020
Figure 78: Fluctuation in in in platinum and palladium prices since 2015 This is is more than
double the the number stolen in the the whole of of 2018
and a a a direct result of of high rhodium values and the value of palladium reaching unprecedented highs 118
$ PER KILO
